| Study Title | Start Date |
|---|---|
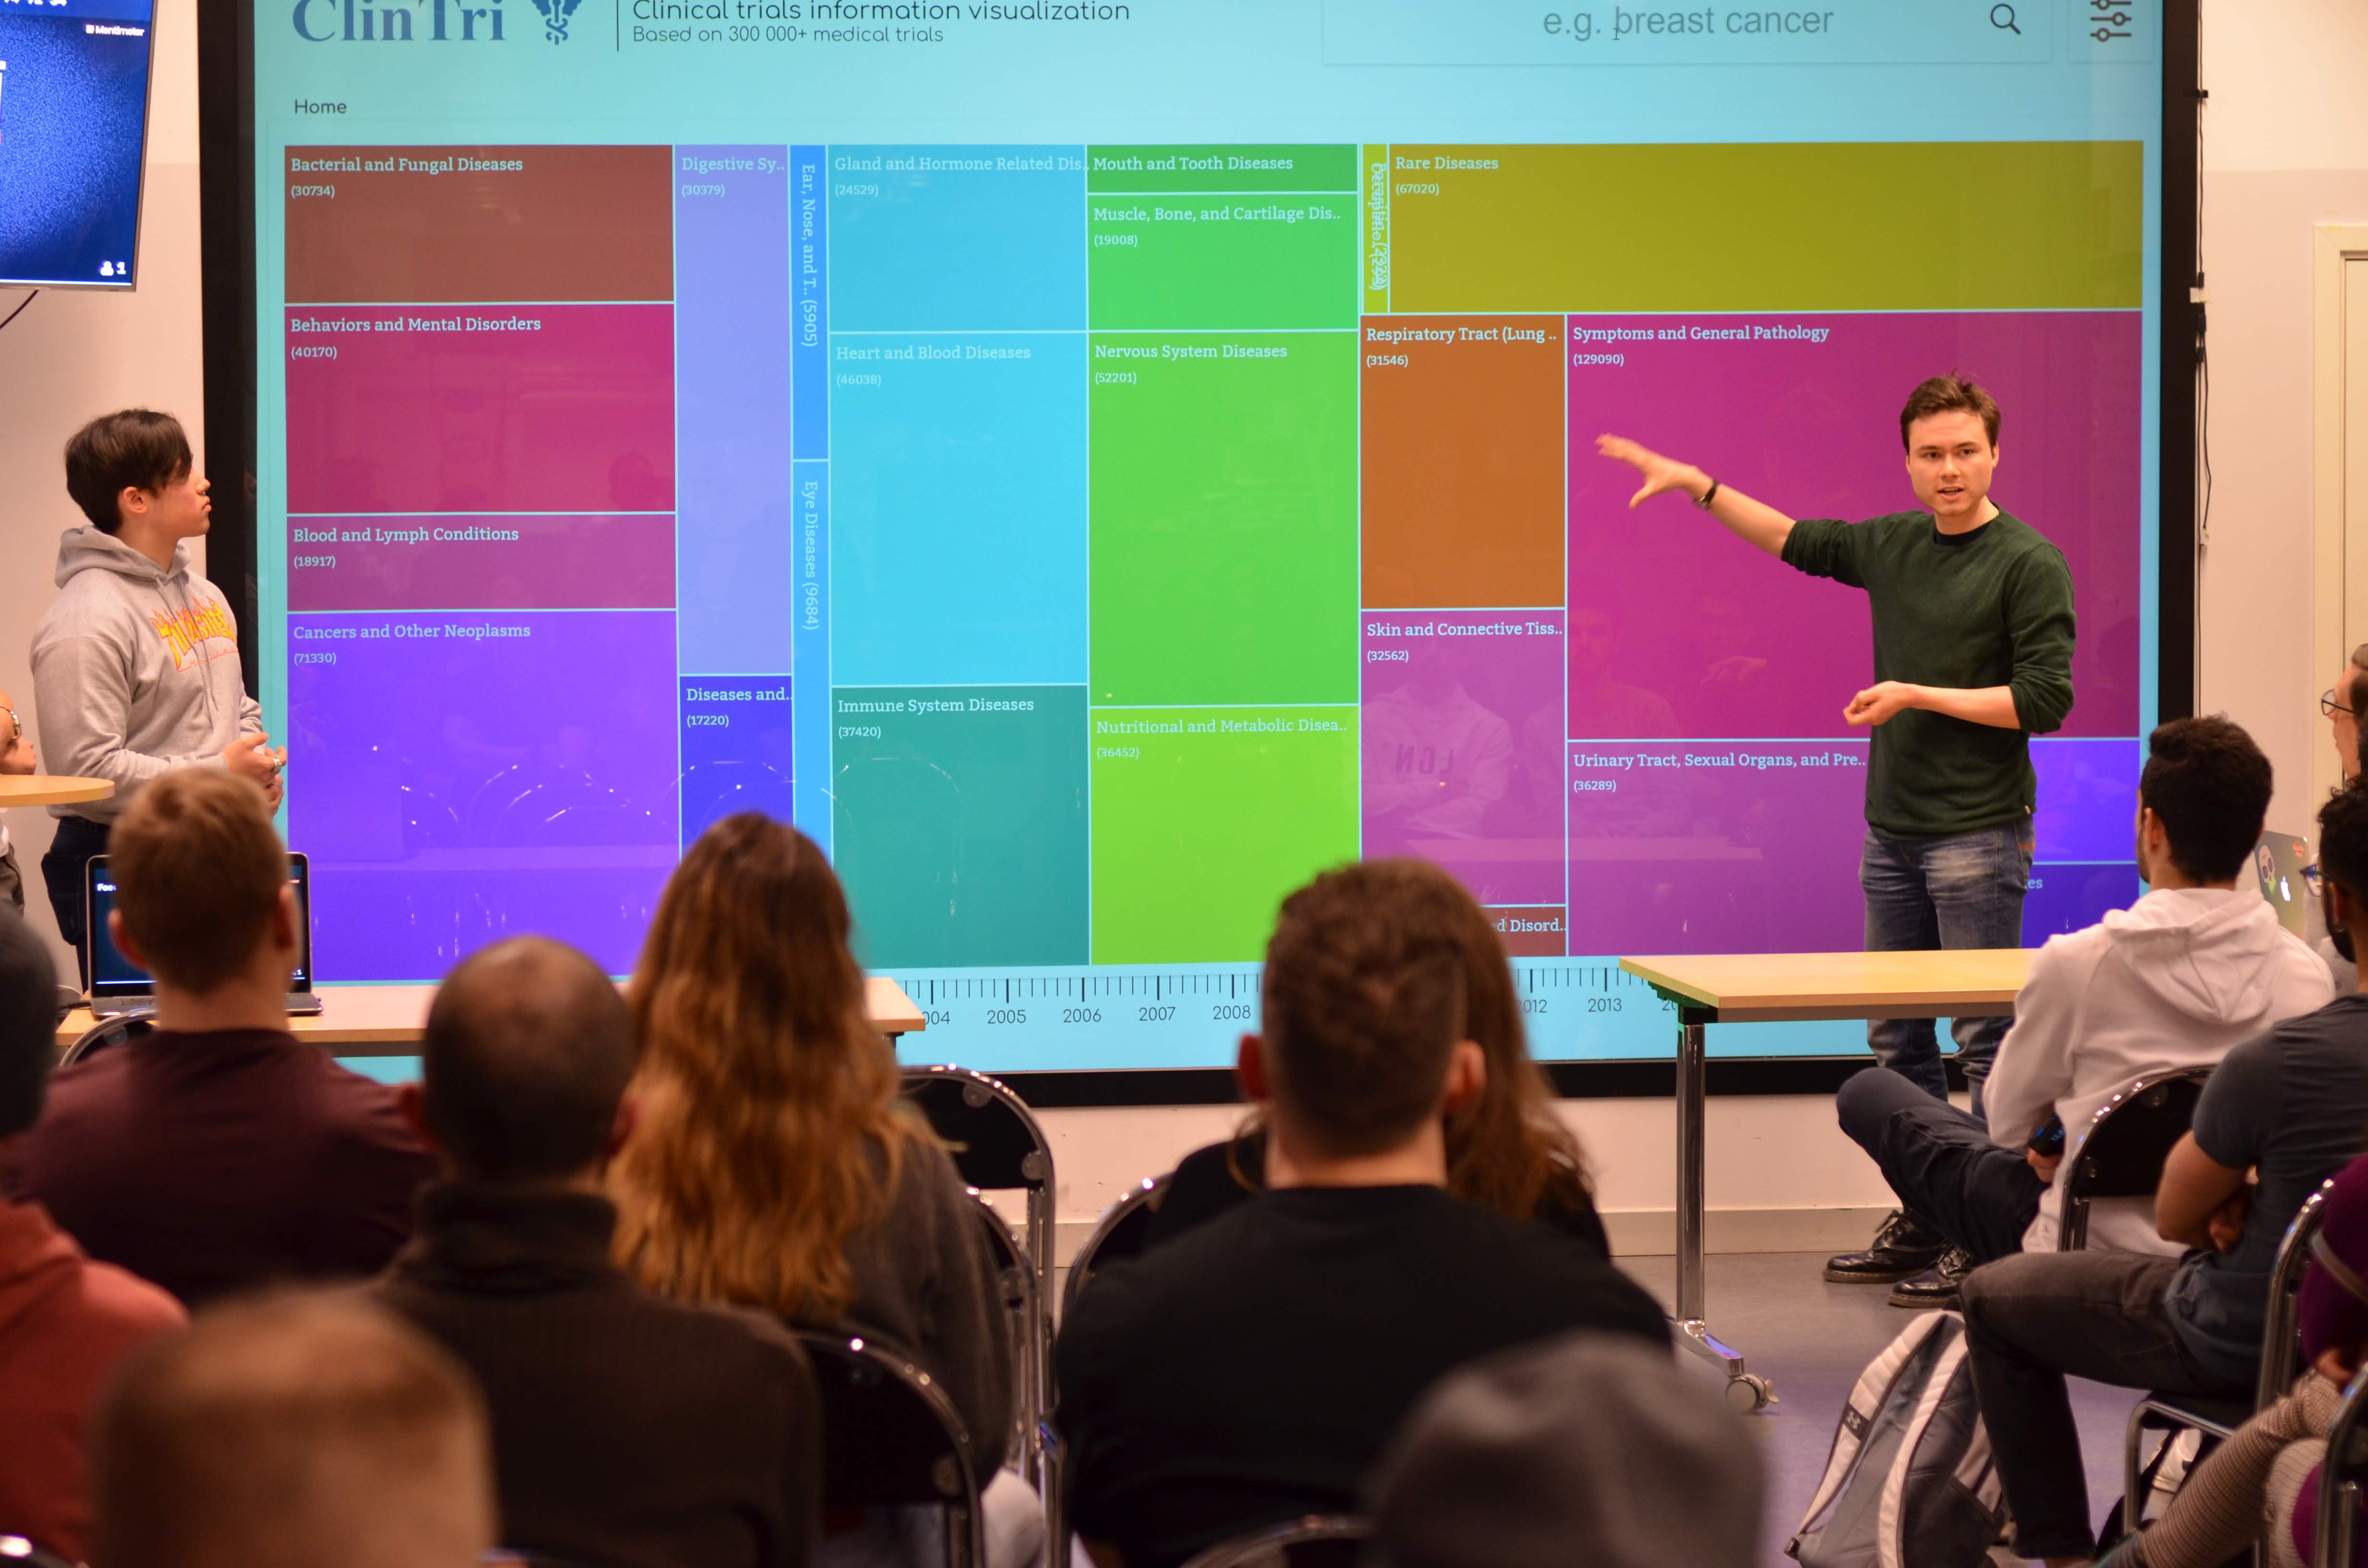
Our mission for this project was to visualize parts of the www.clinicaltrials.gov database to serve a specific purpose defined by a stakeholder from Karolinska Institutet. We were to create a tool that would grant the user a quick state-of-the-art analysis over a specific medical condition based on the phase distribution of trials within a selected timespan. To accomplish this we used a combination of a tree map, a sankey tree and a more traditional table view.

We have learned to use the D3.js library for javascript where we implemented different types of visualizations to show our data. When it comes to more technical learnings, we have developed further skills in web development and source control with git. For the backend we have learned to implement an API with different end-points where we had to work to match them together along with some data preprocessing to make it all work. The dataset was huge and we had to make some decisions to limit it which were interesting to learn. Our teamwork has improved from our first meeting so our collaboration and project management has improved. Along with this we have also learned more about user-testing and communication with stakeholder so that we make sure that we are doing and implementing the features our users need.


